Mocking the Oscars – or any made-for-TV awards spectacle with the fool’s errand of crowning the “best” in the arts – is a time-honored tradition. Sometimes it’s even important, as with last year’s backlash against the whiteness of that Academy Awards slate of Best Picture and acting nominees. (That paleness was a bit of an anomaly in recent times, as I’ll show in a bit.)
So let’s give the Academy its due: Expanding the Best Picture field – starting with 2009 movies – from five nominees to as many as 10 was a smart and ultimately necessary change with substantial benefits, no matter how you parse it.
Consider that in the eight years covering the movies of 2001 to 2008, there was only one Best Picture nominee that dealt primarily with the African-American experience: the bio-pic Ray. In the eight years of the expanded contest, there have been eight (including three this year) – and I’m not counting Django Unchained or The Blind Side.
You can see variety in other areas, too. In the past eight years, seven sci-fi-to-some-degree films have gotten Best Picture nominations. In the eight years prior to that? None, although you’ve got the three Lord of the Rings movies in the fantasy vein. Two animated Best Picture nominees in the past eight years, and none in the eight years before.
In addition to all that, the new Oscars appear to be trending more toward surprise. For 2009, in addition to expanding the Best Picture field, the Academy adopted a preferential voting system for the award – so members rank the nominees instead of just voting for one. Although it took a few years, that has made the night’s final award far less predictable.
Starting with the awards for film year 2000 and ending with 2011, in 11 of 12 ceremonies the movie with the highest number of awards won Best Picture. In 11 of 12 years, the Best Picture winner had the highest or second-highest number of nominations. And in six of those 12 years, the Best Picture winner had the highest number of both awards and nominations. Dull dull dull.
Since then, however, in three of four years the Best Picture hasn’t won the highest number of awards overall. And in two of four years, it didn’t have the highest or second-highest number of nominations.
Those are some sniff tests, and I smell success.
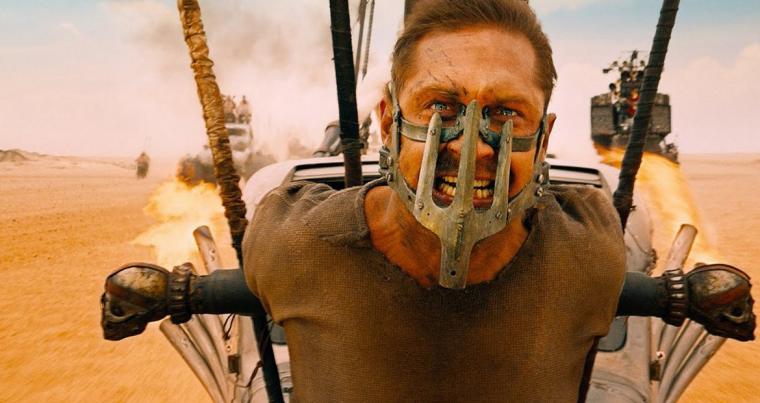
But I wanted more than that. I was looking for evidence supporting my hypotheses that broader Best Picture fields had resulted in slates that were more popular with critics and – in several ways – audiences. I was anticipating, for example, that expansion beneficiary Mad Max: Fury Road would raise all boats with its box office ($153.6 million in the U.S.), critical notices (a Metacritic score of 90), and audience reception (an average user score of 4.2 on Rotten Tomatoes). It would, essentially, more than offset a “prestige” nominee that was neither liked nor seen – something like 2008’s The Reader, with its $34.2-million box office, Metacritic score of 58, and Rotten Tomatoes user average of 3.7.
When I dove into the numbers, however, the results surprised me a little. Using three basic measures of a movie’s success – box-office performance, critical reception, and audience reception – I found that the Fury Roads of the Oscars are no match for dwindling movie audiences and didn’t appreciably change critical feelings about the Best Picture fields. It turns out that recent nominees are more popular with audiences, but only in one sense – and maybe not definitively.
Yet combining all three measures did support my guess – quite strongly.
Let’s take them one at a time.
Box Office. In the crudest measure of box office, the past eight years look pretty good. Twenty-seven Best Picture nominees in the past eight years (nearly 44 percent) have earned more than $100 million at the box office in the U.S. – and Arrival will likely get to that benchmark. In the eight years prior, 12 (30 percent) reached that figure. The median box office of Best Picture-nominated films was $74.8 million over the past eight years, and $58.7 million in the eight years before that. (The averages were $104.9 million over the past eight years, and $91.6 million for the eight years prior.)
But two conflicting trends cloud those figures: escalating ticket prices (up roughly 53 percent from 2001 to 2016) and a declining number of movie tickets sold annually (down more than 15 percent from its 2002 peak to 2016).
If one calculates the number of tickets sold for Best Picture slates (by dividing box office by average ticket prices), it becomes clear that nominees in the expanded era actually perform less well than nominees before expansion. In the past eight years, nominees have averaged 13.2 million tickets (with a median of 9.43 million). In the eight years before that, nominees averaged 14.8 million tickets (with a median of 9.64 million.)
Going back even further – to the eight years from 1993 to 2000 – nominees averaged 23.3 million tickets (with a median of 16.0).
This is the reality of the fragmentation of the entertainment market. People are simply seeing fewer movies in theatres this millennium.
Those numbers make clear why the Academy needed a larger Best Picture field. With more competition for eyes and dollars, the Oscars were destined to become less and less relevant to the average moviegoer with only five nominees. Through expansion, the Academy has created Best Picture fields with a slightly greater number of ticket sold (119 million per year) than from 1993 through 2000 (116 million) – and tickets sales are nearly 60 percent higher than from 2001 to 2008 (74 million).
Critical Reception. Expectedly, expansion of the field hasn’t diminished the quality of the movies in critics’ eyes. With more than 500 movies released in the United States each year, you should be able to pick some good ones whether you limit yourself to five or 10.
But I was wrong that critics’ reviews of movies nominated for the top prize would be decisively higher under expansion.
Using the review aggregator Metacritic, scores based on critics’ reviews for expansion-era Best Picture nominees are nearly identical to an equivalent period pre-expansion. The average score for Best Picture nominees from 2009 to 2016 is 82.6, compared to 81.3 from 2001 to 2008. Median scores are 83.5 for the past eight years, and 83.0 for the eight years before that. So the recent crops have fared ever-so-slightly better with critics – sitting consistently between three and three-and-a-half stars.
Audience Reception. With audiences, the difference is more dramatic. Post-expansion, the average and median scores for Best Picture nominees’ user ratings on Rotten Tomatoes are 4.03 and 4.05, respectively; in the eight years before expansion, they’re 3.73 and 3.70.
I think that difference is real, especially when you consider that the range of Rotten Tomatoes user scores for this crop of movies is 3.3 to 4.5. Three-tenths of a point in that context looms awfully large.
But I’ll add this caveat: There appears to be a bias in favor of newer movies with those user scores. Working backward, average Rotten Tomatoes scores for Best Picture nominees drop each year from 2016 (4.20) to 2011 (3.86).
Still, even the lowest post-expansion number – 3.79 in 2009 – is higher than that eight-year pre-expansion average.

Putting It All Together. Some of you (well, Mike Schulz at least) will recall the long-deceased Box Office Power Rankings, in which I cut through the box-office bullshit to rank movies in current release by four different measures – two based on box office and two based on critics’ reviews.
Using a similar approach, I’ve ranked the past 16 years of Best Picture nominees one through 112 on each of the three core measures presented here: tickets sold, Metacritic average, and Rotten Tomatoes user scores. Add the three ranks together, and you’ve distilled the tests for my hypotheses into one neat and tidy list.
Some interesting trends emerge.
Nine of 15 Best Picture winners from our sample ranked 26th or better – a good sign for La La Land (seventh), the only 2016 nominee that meets that criterion. Moonlight (27th), Hidden Figures (33rd), and Manchester by the Sea (34th) are close. (By the way, the worst Best Picture by these measures – to the surprise of no one – is Crash, at 97th.)
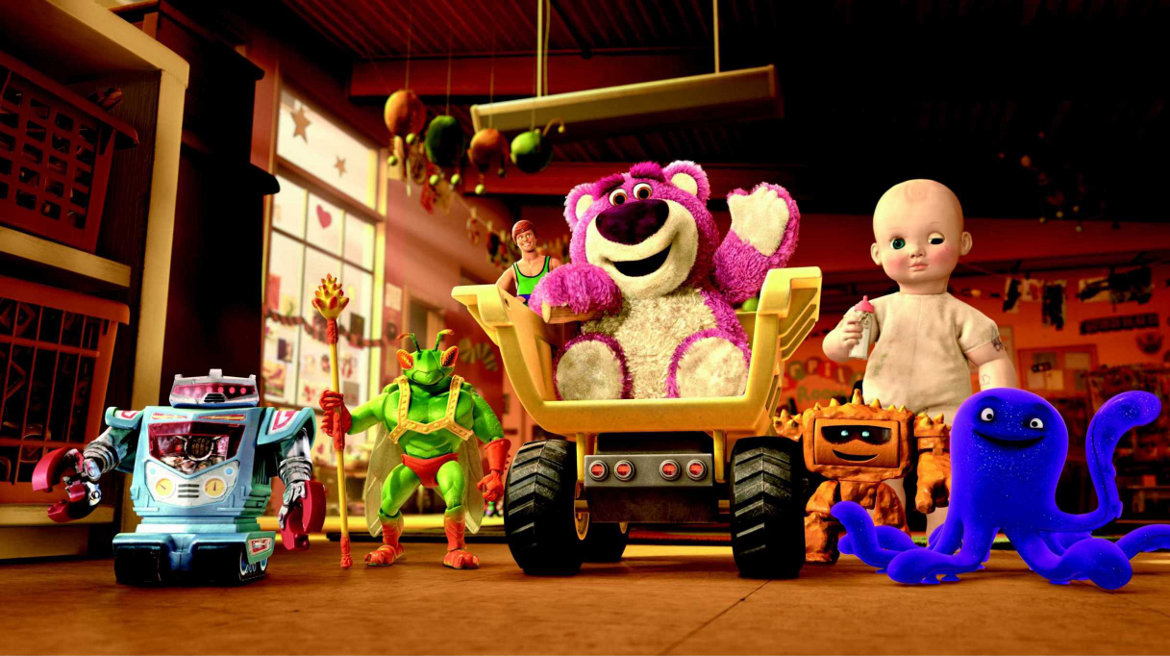
The top 10 (from the top): Toy Story 3 (2010), The Lord of the Rings: The Fellowship of the Ring (2001), The Lord of the Rings: The Two Towers (2002), Gravity (2013), Mad Max: Fury Road (2015), The King’s Speech (2010), La La Land (2016), The Social Network (2010), Argo (2012), 12 Years a Slave (2013).
The bottom 10 (from the bottom): Extremely Loud & Incredibly Close (2011), A Serious Man (2009), Babel (2006), The Reader (2008), The Tree of Life (2011), Good Night, and Good Luck. (2005), Finding Neverland (2004), Munich (2005), Precious: Based on the Novel “Push” by Sapphire (2009), Frost/Nixon (2008).
There’s an awful lot of Oscar bait in the “worst” list, and very little in the “best.” You might also notice that eight of the top 10 are post-expansion, and the other two are Lord of the Rings movies (yet not the one that won Best Picture). And in the bottom 10, six come from the pre-expansion era.
This would seem to support my basic premise that expansion has been good for Oscar.
But we can take it a step further by averaging the ranking of each year’s Best Picture nominees, thus creating an ironclad, entirely scientific, irrefutable answer to the question: Has Best Picture expansion resulted in better, more-popular movies?
Best Picture movie slates, best to worst (with post-expansion years in italics): 2015, 2012, 2013, 2010, 2016, 2014, 2007, 2002, 2001, 2003, 2006, 2009, 2011, 2004, 2008, 2005.
The top six all featured expanded Best Picture lineups, while the bottom three had the more-traditional five nominees.
So Hollywood got this one right, and I’ve got the numbers to prove it.
And, finally, here are all those years’ Best Pictures if this system (instead of actual voters) picked the winner.
2001: The Lord of the Rings: The Fellowship of the Ring (2) instead of A Beautiful Mind (60, second among the year’s nominees).
2002: The Lord of the Rings: The Two Towers (3) instead of Chicago (61, third among the year’s nominees).
2003: The Lord of the Rings: The Return of the King (15, actual winner).
2004: Million Dollar Baby (44, actual winner).
2005: Brokeback Mountain (76) instead of Crash (97, third among the year’s nominees).
2006: The Departed (13, actual winner).
2007: Juno (20) instead of No Country for Old Men (23, second among the year’s nominees).
2008: Slumdog Millionaire (19, actual winner).
2009: Avatar (11) instead of The Hurt Locker (63, fourth among the year’s nominees).
2010: Toy Story 3 (1) instead of The King’s Speech (6, second among the year’s nominees).
2011: The Artist (26, actual winner).
2012: Argo (9, actual winner).
2013: Gravity (4) instead of 12 Years a Slave (10, second among the year’s nominees).
2014: The Grand Budapest Hotel (29) instead of Birdman (88, seventh among the year’s nominees).
2015: Mad Max:Fury Road (5) instead of Spotlight (18, third among the year’s nominees).
2016: La La Land (7).